A course in introductory algebraic topology
This fall I have been teaching Topology I (Topology II next spring). I decided to emphasize algebraic topology and in fact started with it rather than point set topology which alone can take two semesters.
Outline
This is an introductory, two semester course on algebraic topology and its applications. It is intended for advanced undergraduate and beginning graduate students.
Part 1. Introduction to algebraic topology
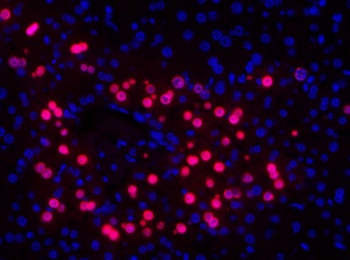
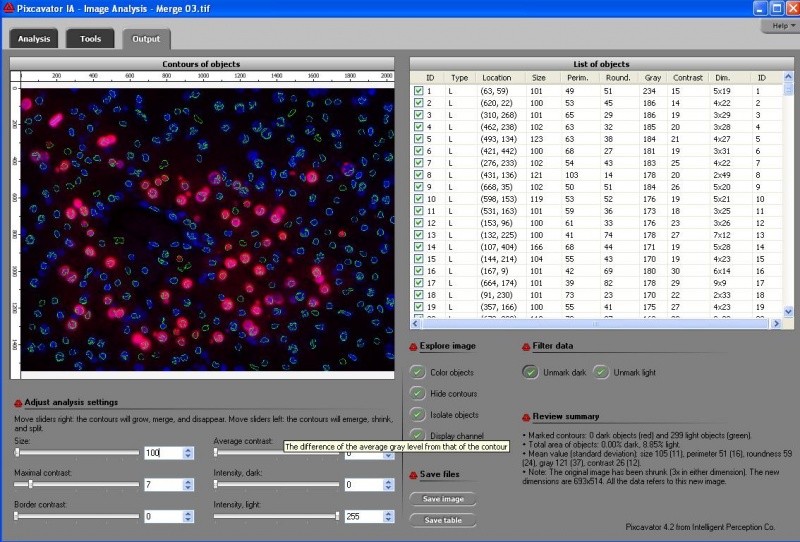
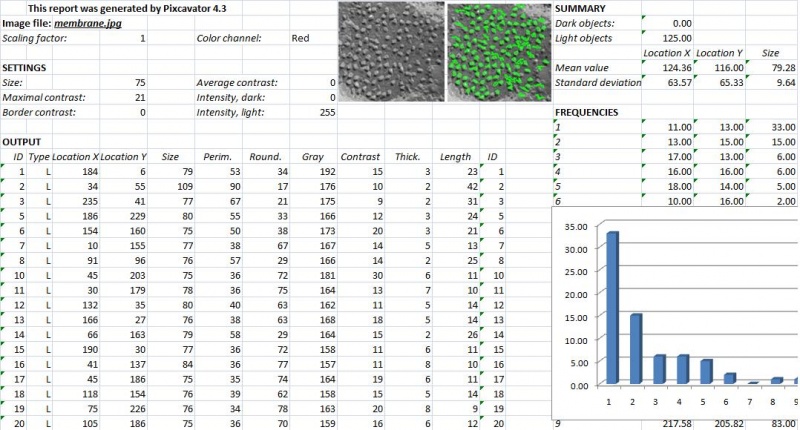
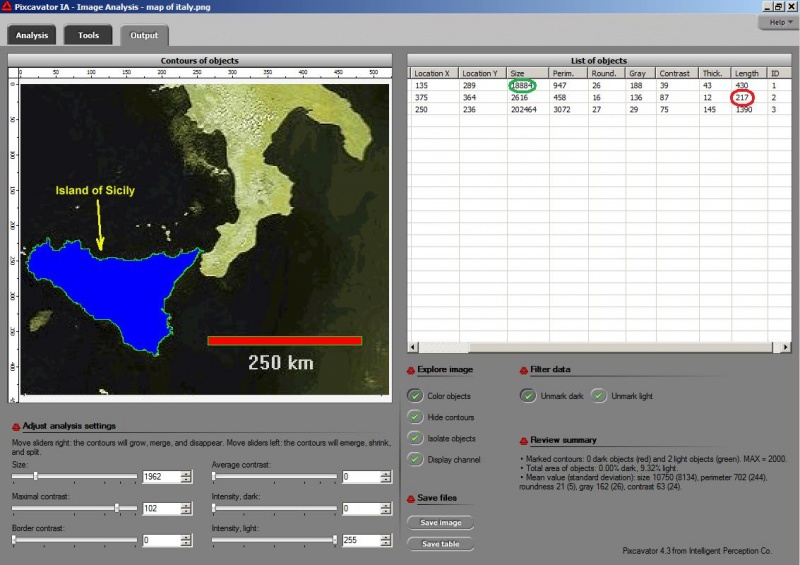
Starts with topological issues in digital image analysis, informal introduction of homology
Part 2. Homology theory
Cubical complexes, their homology, and maps
Part 3. Overview of point-set topology
Minimized to the extreme (still could have cut even more)
Part 4. Homology groups
A more formal, group theory based, exposition
Part 5. Homology and uncertainty
Applications in computer vision, image analysis and data analysis
Part 6. Beyond homology
The fundamental group and cohomology
Also, I ran across this white paper from Hewlett-Packard: Algebraic topology for computer vision. Good review and an honest attempt to convince the practitioners to that this is something that they might need to know (good luck with that!).
Digital discoveries
- Casinos Not On Gamstop
- Non Gamstop Casinos
- Casino Not On Gamstop
- Casino Not On Gamstop
- Non Gamstop Casinos UK
- Casino Sites Not On Gamstop
- Siti Non Aams
- Casino Online Non Aams
- Non Gamstop Casinos UK
- UK Casino Not On Gamstop
- Non Gamstop Casino UK
- UK Casinos Not On Gamstop
- UK Casino Not On Gamstop
- Non Gamstop Casino UK
- Non Gamstop Casinos
- Non Gamstop Casino Sites UK
- Best Non Gamstop Casinos
- Casino Sites Not On Gamstop
- Casino En Ligne Fiable
- UK Online Casinos Not On Gamstop
- Online Betting Sites UK
- Meilleur Site Casino En Ligne
- Migliori Casino Non Aams
- Best Non Gamstop Casino
- Crypto Casinos
- Casino En Ligne Belgique Liste
- Meilleur Site Casino En Ligne Belgique
- Bookmaker Non Aams
- カジノ ライブ
- онлайн казино с хорошей отдачей
- スマホ カジノ 稼ぐ
- ブック メーカー オッズ
- Top 3 Nhà Cái Uy Tín Nhất
- Trang Web Cá độ Bóng đá Của Việt Nam
- Casino En Ligne Avis
- Casino En Ligne France
- Casino En Ligne
- 꽁머니 토토
- Casino Online Non Aams
- Migliori Casino Non AAMS
- Meilleur Casino En Ligne
- Casino En Ligne France Légal
- Casino En Ligne France Légal
- Casinos En Ligne
- Mejores Casinos Online