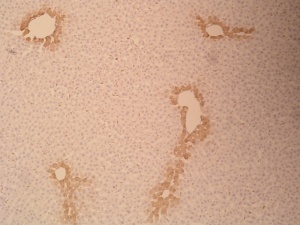
This image analysis example came from a biomedical researcher: “I would like to know if the program can calculate relative areas and analyse differences in immunostaining intensity… In images 1 and 2, I need to know if Pixcavator can convert image 1 in 2 and then in image 2 giving a percentage of the are in red in relation to the all field. In image 3, I need 2 things (it is an immunostaining of the liver). I need to know if the program can give me a level of intensity of the immunostaining (that is the intensity of brow in the image) and secondly the fraction of the area that is immunostained (i.e., brown coloured).”
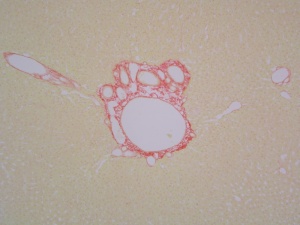
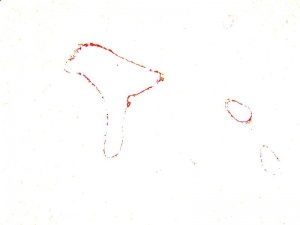
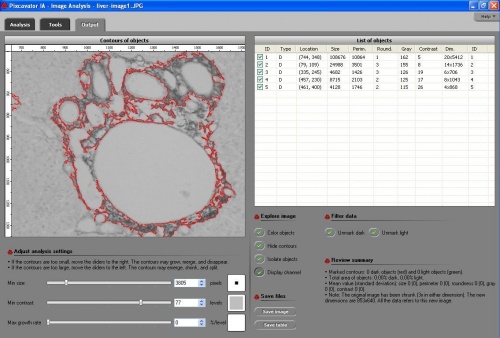
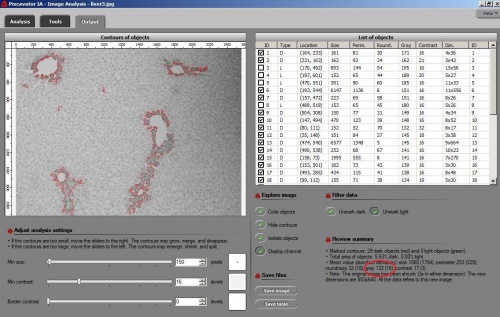
After a few minutes of experimenting with Pixcavator, this is best I can do for now (screenshot #1 below). As you can see some of the red area is not captured while some holes are counted (#2). To find area of those holes I had to analyze the image with different settings (#3). So, the total area of the red is approximately:
10864+3501+1426+2103+1746-1477-1453 = 16710.
Then the percentage is
16710/(853×640) = 3%.
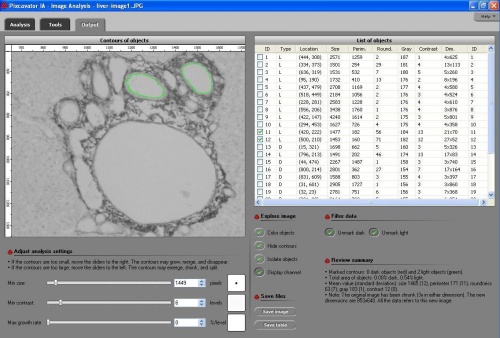
Unsatisfied with the result, I modified the software: I used thresholding as the 2nd slider instead of contrast and redid the analysis. The result was 5.51-1.65=3.86%, much better.
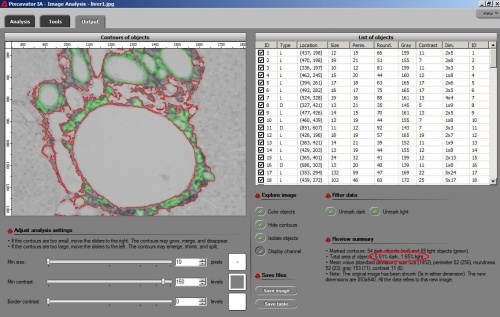
The third image was trickier because the lighting is uneven. Initially I was unable to capture all brown areas - not simultaneously. Certainly, cropping the image and analyzing parts one by one is an option. (The average color, it is displayed for each contour under “Gray” in the Pixcavator’s output table). That’s something to keep in mind: what is displayed is the average intensity with respect to the color channel that you’ve chosen, in this case “Green”. (The ability to compute the average color with respect to all three channels is still under development.)
Unsatisfied with the result, I came up with another modification: I used average contrast for the 2nd slider and redid the analysis. The result was much better. The average gray (intensity in the green channel) was 132.
The two modifications will appear in version 4.2 due in June.
Comments Off
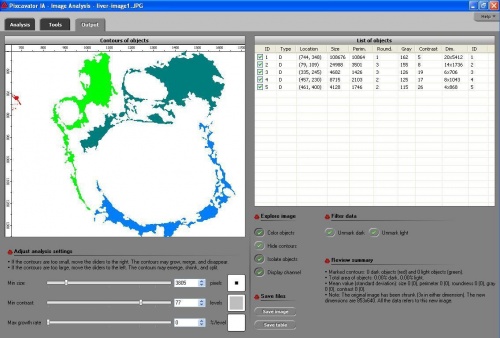
This version of Pixcavator has only one new feature: the analysis is precomputed. The result is that moving sliders produces immediate effect on the contours and finding the best contours becomes very quick. You can see the effect in this video. The analysis stage is however quite longer than in the previous versions. So, before making this feature permanent I want to get some feedback from the users. That’s why this is just a test release.
Comments Off
The link is to a poster presentation made at the last meeting of Association for Research in Vision and Ophthalmology (ARVO) by Dr. Nalin Mehta. The title (shortened) is Evaluation of Choroidal Circulation Using Collapsed C-Scan Imaging. The goal is “to better differentiate between the various components and sub-types of age-related macular degeneration”. Further:
En face (C-scan) OCT images, collapsed and summated in the antero-posterior axis, were acquired for all patients over approximately monthly intervals throughout their treatment regimen. These images were standardized and analyzed using Pixcavator 3.1 (Intelligent Perception Co., Huntington, WV), an image analysis program which first captures the contours of the choroidal vascular pattern, differentiating the same from background scatter phenomenon, and then quantifies this pattern in proportion to the entire scanned area, producing an Excel (Microsoft Corp., Sacramento, CA) spreadsheet with locations and measurements of these vascular structures.
Before this became possible some challenges of image analysis had to be confronted: article in the wiki.
Comments Off
The full name is IMA New Directions Short Course Applied Algebraic Topology. It is run in the Institute for Mathematics and Its Applications located on campus of the University of Minnesota.
I attended another IMA short course in 2004. The course was called Computational Topology and it changed the direction of my research. Until then my interests were in algebraic topology and fixed point theory. After the course I became convinced that algebraic topology would have serious industrial applications. It took me another year to find my personal interest - digital image analysis.
The main focus of the current course will be on how algebraic topology can contribute to methods of data analysis. This topic is of special interest to me as I am also working on image-to-image search applications.
Comments Off