


Graph representation of gray scale images
 Recently, I had an opportunity to reread some of the papers on this subject. One of them has an especially simple example and I decided that this may be an appropriate place to make a comparison to the way we do this.
The paper (and others by these authors) I am referring to is:
J. Andrew Bangham, J. R. Hidalgo, Richard Harvey, Gavin C. Cawley, The Segmentation of Images via Scale-Space Trees, British Machine Vision Conference, 1998.
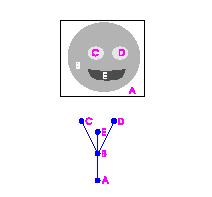
Their algorithm (called “sieve”) produces a tree decomposition of gray scale images as follows. It cuts (simultaneously!) minima and maxima of the gray scale function - slice by slice. The result is a hierarchy of objects (called “granulas”) that is recorded as a tree. Their example is on the right.
This tree may resemble our frame graphs – until you build one. This is what it looks like. He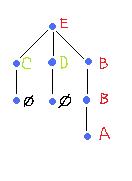 re the gray scale levels run from 0 (E) to 255 (A).
Generally the frame graph isn’t a tree (try the negative of this image). This comes as a consequence of treating light and dark objects (maxima and minima) separately and independently. Indeed, dark objects may merge while light objects may split as you go up the gray levels.
There are other issues. First, the central (in my view) question of what is object in a gray scale image and how to count them isn’t addressed in this and related papers. Second, the approach is only partially applicable to 3D images as there is no way of capturing tunnels without homology. Third, it is unclear how this approach can be applied to color images.
Other than that I like those papers because the testing performed by this group validated our approach.
Digital discoveries
- Casinos Not On Gamstop
- Non Gamstop Casinos
- Casino Not On Gamstop
- Casino Not On Gamstop
- Non Gamstop Casinos UK
- Casino Sites Not On Gamstop
- Siti Non Aams
- Casino Online Non Aams
- Non Gamstop Casinos UK
- UK Casino Not On Gamstop
- Non Gamstop Casino UK
- UK Casinos Not On Gamstop
- UK Casino Not On Gamstop
- Non Gamstop Casino UK
- Non Gamstop Casinos
- Non Gamstop Casino Sites UK
- Best Non Gamstop Casinos
- Casino Sites Not On Gamstop
- Casino En Ligne Fiable
- UK Online Casinos Not On Gamstop
- Online Betting Sites UK
- Meilleur Site Casino En Ligne
- Migliori Casino Non Aams
- Best Non Gamstop Casino
- Crypto Casinos
- Casino En Ligne Belgique Liste
- Meilleur Site Casino En Ligne Belgique
- Bookmaker Non Aams
- カジノ ライブ
- онлайн казино с хорошей отдачей
- スマホ カジノ 稼ぐ
- ブック メーカー オッズ
- Top 3 Nhà Cái Uy Tín Nhất
- Trang Web Cá độ Bóng đá Của Việt Nam
- Casino En Ligne Avis
- Casino En Ligne France
- Casino En Ligne
- 꽁머니 토토
- Casino Online Non Aams
- Meilleur Casino En Ligne


")


