This site is devoted to mathematics and its applications. Created and run by Peter Saveliev.
Analysis strategy
From Intelligent Perception
In this article we explain how to achieve best results with Pixcavator.
Before you start, review this article Images appropriate for analysis.
1 General strategy
With Pixcavator, image analysis takes three stages:
- Stage 1: automatic. A data structure – graph – is created that contains complete data about the image.
- Stage 2: semi-automatic. The user moves sliders corresponding to objects’ characteristics to instantly change their boundaries and choose the best segmentation. The output data is updated in real time.
- Stage 3: manual. The user can exclude the remaining noise and irrelevant details from the image and the output of analysis by simply clicking on them.
What happens during stage 2? If your initial settings are too low, the captured objects may be too small. they may represent some features of "real" objects - the ones you care about. Move sliders to the right! As a result the smaller objects will start to grow and merge. at some point, however, they will start to disappear as the settings become to high. Keep in mind that this description does not apply to all the sliders. For example, moving the "Border contrast" slider may produce various effects, even nested contours.
Do not expect to get perfect results in the first attempt. To get good results you may have to analyze an image under several different settings. It is an iterative process and after each attempt you will come closer to your goal.
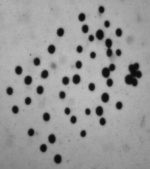
Let’s consider an example. Suppose you have an image with several larger and several smaller objects and several objects with higher contrast and several with lower contrast. Now, suppose you know a priori that those larger objects with higher contrast are interesting objects - for example, cells - and the rest is noise. Then the strategy is as follows. Start with the size value that is about the average of the sizes of the larger and the smaller cells and the contrast value that is about the average of higher and lower contrast. Run analysis and observe the segmented image. If some of the noise is captured, increase the thresholds. If some cells aren’t captured, decrease the thresholds.
One indication that you may have reached the optimal settings is when you see contours tightly hugging the objects (cells).
To get the best results, go beyond the optimum segmentation (in the automatic mode) and the then de-select the objects (in the manual mode) that you know are noise.
The next stage is Filtering output data.
2 How to use partial analysis
The example below is carried out with the image of cells above. For a novice user it would take many attempts to find good settings for the sliders. It would take a while to finish the job because the image is 378x425 and it takes a few seconds to process - every time. With ROI analysis the processing time may be reduced 10 fold.
Step-by-step procedure:
- Size setting
- Draw a square (ROI) around one of the smallest cells. Analyze.
- Move the Size slider to the right in small increments and reanalyze until the contour around the cell looks tight.
- Go to the table and make a note of the size of this cell. In our example, it is 200.
- Reduce this number by 10-25%. Set the Size slider to that value. In our example, it is 150.
- Contrast setting
- Clear the ROI and draw a new ROI around one of the cells with lowest contrast. Analyze.
- Move the Contrast slider to the right in small increments and reanalyze until the contour around the cell looks tight.
- Go to the table and make a note of the contrast of this cell. In our example, it is 80.
- Reduce this number by 10-25%. Set the Contrast slider to that value. In our example, it is 70.
- Full image
- Analyze the whole image with these settings of the sliders for Size, Contrast etc. In our example, these are 150 for Size, 70 for Contrast.
- Move the sliders to the right in small increments and reanalyze until the contours around the cells look tight.
Digital discoveries
- Casinos Not On Gamstop
- Non Gamstop Casinos
- Casino Not On Gamstop
- Casino Not On Gamstop
- Non Gamstop Casinos UK
- Casino Sites Not On Gamstop
- Siti Non Aams
- Casino Online Non Aams
- Non Gamstop Casinos UK
- UK Casino Not On Gamstop
- Non Gamstop Casino UK
- UK Casinos Not On Gamstop
- UK Casino Not On Gamstop
- Non Gamstop Casino UK
- Non Gamstop Casinos
- Non Gamstop Casino Sites UK
- Best Non Gamstop Casinos
- Casino Sites Not On Gamstop
- Casino En Ligne Fiable
- UK Online Casinos Not On Gamstop
- Online Betting Sites UK
- Meilleur Site Casino En Ligne
- Migliori Casino Non Aams
- Best Non Gamstop Casino
- Crypto Casinos
- Casino En Ligne Belgique Liste
- Meilleur Site Casino En Ligne Belgique
- Bookmaker Non Aams
- カジノ ライブ
- онлайн казино с хорошей отдачей
- スマホ カジノ 稼ぐ
- ブック メーカー オッズ
- Top 3 Nhà Cái Uy Tín Nhất
- Trang Web Cá độ Bóng đá Của Việt Nam
- Casino En Ligne Avis
- Casino En Ligne France
- Casino En Ligne
- 꽁머니 토토
- Casino Online Non Aams
- Migliori Casino Non AAMS
- Meilleur Casino En Ligne
- Casino En Ligne France Légal
- Casino En Ligne France Légal
- Casinos En Ligne
- Mejores Casinos Online